Robinhood S-1 Teardown
Democratization, disruption and day-trading
Hi friends,
Robinhood’s much anticipated S-1 filing became public last week. I’ve written about the company before, but now that a lot more information about it is public, it’s worth writing about again.
I’ll go into some takeaways from the S-1 ahead of its IPO.
Disruption
As I wrote about previously, Robinhood deserves credit for being a truly disruptive company.
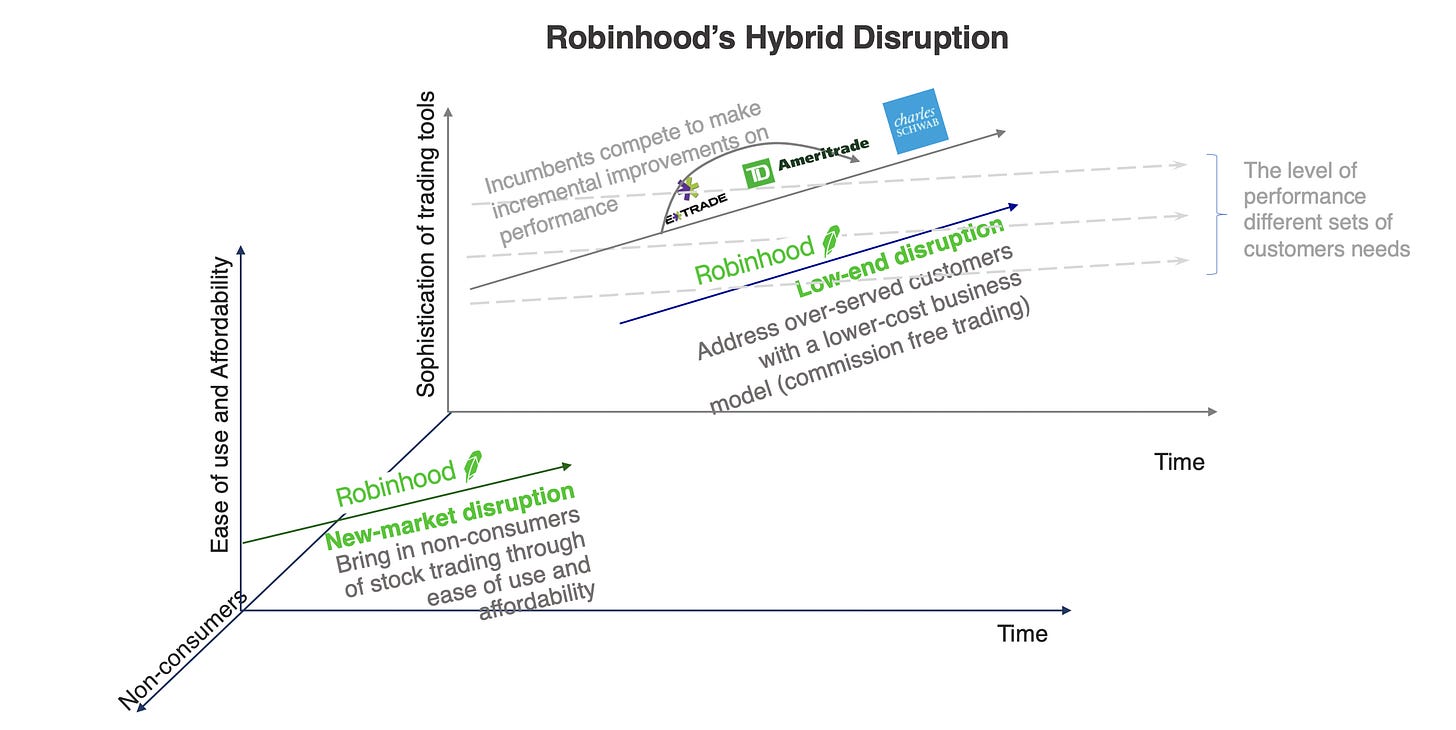
Robinhood set out of the mission to democratize investing for all. And by offering commission-free trading through a simple, well-designed mobile app, Robinhood was a disruptor in the textbook sense of the term, both from a “low-end” and “new-market” perspective.
Low-end disruptor: Robinhood’s commission-free trading, while not as feature-rich initially as competitors, was a lot cheaper (free) compared to competitors which charged ~$5-10 per trade. It, therefore, appealed to the lower end of the market that was investing.
New-market disruptor: The simple interface combined with no fees appealed to a new segment of the market and brought them into investing. These included young people and students and others for whom the existing products were too expensive or complex.
We know this from some of the data they provide in the filing. Over half of their 18M customers are new investors.
And that doesn’t even include all the new investors who joined other brokerages (that came after Robinhood or adapted Robinhood’s no-fee trading to respond to it) post the “Robinhood effect”.
Creative Destruction and Profit Pools
Schumpeter described creative destruction as the incessant product and process innovation mechanism by which new production units replace outdated ones. Arguably, Robinhood’s commission-free approach eventually sparked the creative destruction of the brokerage industry.
Other brokerages such as Schwab and E*Trade, which found it difficult to respond initially due to how counter Robinhood’s approach was to their approach and how much it would cost them to respond, ultimately decided they had to respond or be disrupted.
And so over a span of a few months in 2019, Schwab and others all moved to commission-free trading. This destroyed a revenue stream (commissions) of $1.5B+ which was essentially pure profit. This basically meant that Robinhood and the response it invoked from competitors was able to give back that $1.5B to consumers in the form of surplus.
Now naturally, one would think this would make the brokerage industry a lot small over time from a market cap perspective right? And that’s likely what might have been the case was it not for the ensuing growth in trading that followed, partly because of the environment, and partly because of Robinhood’s excellent gamification mechanics.
With that context, let’s go deeper into Robinhood’s business.
Business Model
At a high level, Robinhood makes money in three main ways:
Transaction revenue (80% of revenue)
Transaction revenue refers to the revenue that Robinhood gets paid for routing customer orders for options, equities, and cryptocurrencies to market makers.
On equities and options trades, this is typically called payment for order flow, and for crypto transactions, this is typically called transaction rebates.
In aggregate, it makes up about ~80% of their revenue, with the split of this revenue stream being:
47% from options
32% from equities
21% from crypto
The bulk of this revenue, comprising ~60% of total revenue comes from three market makers:
Citadel Securities (34%)
Susquehanna (18%)
Wolverine (10%)
Net interest revenues (12% of revenue)
Robinhood also makes money in the form of interest primarily on:
providing margin loans to users (55%)
allowing third-parties to borrow securities, typically for shorting stocks (45%)
Other / Subscriptions (8% of revenue)
Robinhood also makes money from subscriptions to Robinhood Gold which is a premium offering that allows for level II market data and allows users to borrow to trade on margin and other fees charged to users (such as when they transfer accounts to other brokers which grew a lot in Q1 ‘21 tied to the outages and the reaction to them).
The bulk of it likely comes from the monthly fees charged to the ~1.4M Robinhood Gold Subscribers.
Performance
As expected, between the pandemic and the corresponding stimulus checks and the rise of retail investors and meme stocks, Robinhood has had a bonkers 2020 (and 2021 so far).
Key Metrics
Looking at a few key metrics for 2020:
Net cumulative funded accounts grew 143% to 12.5M
Monthly active users grew 172% to 11.7M
Assets under custody grew 345% to $63B
Revenue grew 245% to $959M
Adjusted EBITDA margins went from -26% to +16%
So, they brought in a lot more users, a lot more of these users were active and holding a lot more money with Robinhood, they made more money per active user, and they became more profitable with all of that happening.
As of March 2021, Robinhood has 18M net cumulative funded accounts, with 17.7M of them active monthly and $81B of assets under custody.
User Growth and Engagement
It’s worth touching on the user growth and engagement of Robinhood.
On the user growth side, yes, while the growth of users and accounts was absolutely bonkers, with accounts growing ~145% y/y as in the chart below, one of the most impressive things about Robinhood is that ~80% of new funded accounts in 2020 and 2021 joined the platform organically or through Robinhood’s referral program (where the referrer and referee each receive a free share).
Robinhood has obviously been in the press a lot these past couple of years, often for the wrong reasons, but in the end in this case, at least, the adage about all press being good press has been true, or at least the average investor doesn’t care about their various problems and just want a simple and low-fee app.
On the user engagement side, what is crazy is that Robinhood has the engagement levels of a top-tier social network:
98.3% of all funded accounts use the product monthly
The DAU/MAU ratio is ~47%. For context, the very best social networks tend to be in the 50-65% range, so it’s quite crazy that the daily usage rate for Robinhood is that high.
Now, I don’t think is good for the typical investor but it highlights how effective Robinhood has been at creating an addictive and gamified app.
Unit Economics
Let’s see how user engagement has translated into unit economics.
As you can see below, CAC has continued to go down, and users are more active with more money in the accounts and the average revenue per user has gone up.
The revenue payback period has gone from 13 months in 2019 (already quite good) to under 5 months in 2020 to likely ~3 months in Q1 of 2021, which is really impressive.
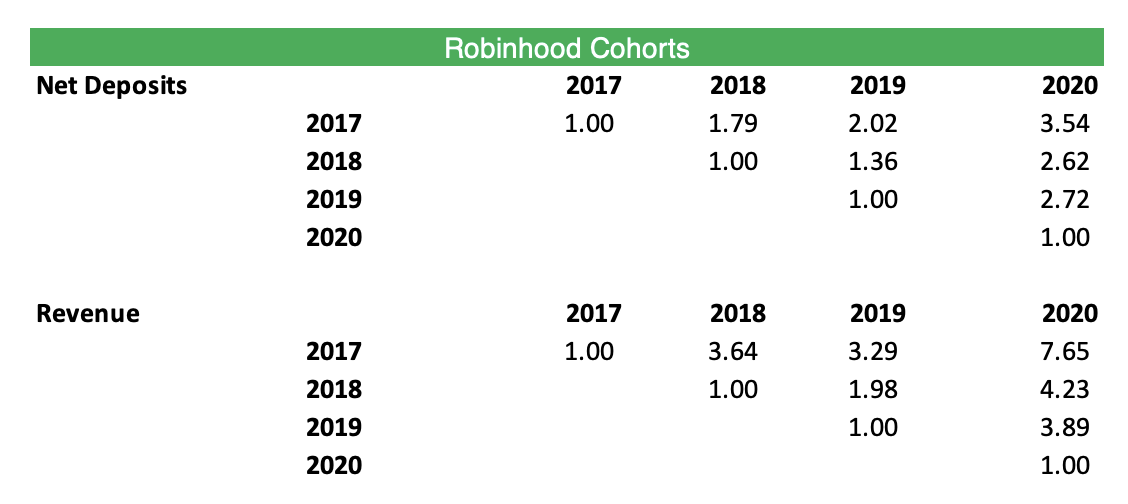
Looking at cohort behavior, it does seem to be the case that Robinhood is acquiring customers early who continue to grow their deposits and investing with Robinhood, as is visible from some of the cohorts charts below.
Net deposits from the early cohorts are almost 2-3X that of their initial years, and revenue from earlier cohorts was growing over time, even before the 2020 pandemic
2020 was a crazy accelerant, leading to big growth in existing cohorts and leading to a large increase in net new deposits from new users, as in the second chart below.
Financials and Profitability
We’ve talked about overall performance, but it’s worth getting a sense of some of the high-level cost drivers and profitability.
On the revenue side, Robinhood is on a >$2B run-rate, after doing ~$277M in 2019.
Revenue grew 245% in 202 and 309% in 2021, from a mix of growth in new accounts, and increasing growth from existing accounts as we touched on above.
The pandemic and the related consequences (stimulus checks, rise of retail, meme stocks, low-interest-rate environment) was obviously a big accelerant, and trading activity might go down as the markets cool off, but Robinhood now has a larger user base, and typically the cohorts continue to grow deposits over time, and so I expect a lot of the users to sustain although I don’t expect triple-digit growth (on an annual basis) going forward.
Looking at the adjusted financials, a few things stand out:
Robinhood has pretty good gross margins of ~85-90%. The main costs are around clearing and executing trades, which are typically quite small and have been going down as a percent of revenue over time.
Robinhood’s profitability improved by over 40 percentage points during the pandemic. Almost every cost line item grew more slowly than revenue, but a big driver of it was increased scale and massive revenue growth with roughly flat marketing expenses.
Marketing was the biggest cost (~45%) but now represents under 20% of revenue, while the user base almost tripled, highlighting the importance of the word of mouth touched on earlier.
The G&A number and operations numbers seemed a bit high to me, so there might be room for continuous improvement in profitability, especially in the operations and G&A line items.
Crypto
We’ve touched on crypto briefly in their business model, but it’s worth quickly touching on Robinhood’s crypto operations separately.
Users: 9.5 million customers traded crypto on Robinhood in Q1 2021.
Assets: Robinhood’s Crypto assets under custody have gone parabolic since 2019. It increased 8.5X in 2020, and has grown another 3.3X in Q1 of 2021, and now represents 14% of assets under custody at Robinhood.
Volumes: There was $88B of crypto trading volume on Robinhood. For context, Coinbase has 335B of total volume in the quarter, but only 101B from retail. So the retail operations are pretty close in size.
Revenue: Revenue from crypto grew ~20X to $81M in Q1, and represented 17% of total revenues in Q1 2021 from 3% in Q1 2020.
One thing that jumps out is that Robinhood is almost doing as much trading volume in Crypto as Coinbase, but making a lot less on it. This is because of Coinbase’s high fees, which as I’ve written about before, are a big risk for Coinbase and will be hard to sustain in the face of competition.
As in the comparison below, Robinhood’s take rate on crypto is less than a tenth of Coinbase’s take rate.
One other tidbit worth highlighting is that for Q1 of 2021, 34% of Robinhood’s crypto revenue (and so ~6% of their total revenue) came from transactions on DOGE coin.
Brokerage Comps
Comparing Robinhood to some traditional brokerages highlights a few key things:
Robinhood is quickly catching up in terms of the number of accounts: Only Fidelity and Schwab (which owns TD Ameritrade) are larger, and Robinhood is growing accounts much faster. Robinhood also states that they believe that “close to 50% of all new retail funded accounts opened in the United States from 2016 to 2021 were new accounts created on Robinhood”.
Robinhood has a lot fewer assets under custody per account than other brokerages - often 20-30X less. While not surprising, it highlights both that they appeal to younger, newer investors, and that they have a big opportunity ahead of them if they can become the platform of choice for these individuals. Additionally, some of these brokerages offer retirement accounts, so it isn’t an exact comparison, but that’s also another potential growth avenue for Robinhood.
However, Robinhood’s revenue, when adjusted for assets is quite high. They made 3-7X more per $ in custody than other brokerages. This is largely driven by the money in the account being traded more frequently, and being used for options trading more frequently. Naturally, if they add on retirement accounts that number will go down, but it is also interesting if the “overtrading” will continue as these customers get more sophisticated over time.
Lastly, even post the death of commissions, brokerages tend to have pretty high operating margins. Robinhood naturally isn’t there yet and nor should it be expected to be given its growth, but that 30-35% long-term operating margins could be a benchmark they try to aim for over time.
I won’t say much about valuation other than that if you assume 30-35% long-term margins, and a 25-30X multiple on earnings in 2025, a $40-50B valuation isn’t unreasonable since it needs just a ~2.5X top-line growth over the 4 years.
Closing Thoughts
One way of thinking about Robinhood is that it applied the decades of Silicon Valley learnings in gamification and designing addictive products to the incentive in front of it: more trading (and ideally of options) means more money. Combine that with the pandemic and a low-interest-rate environment with stimulus checks abound and you have a very good business, which definitely brought new investors into the ecosystem although the actual outcome of whether that is good or bad given the levels of trading activity they are partaking in is yet to be determined.
While I’ve not touched too much on some of the gamification and other practices of Robinhood, I recommend this previous piece I wrote for more on that.
One other interesting part of Robinhood’s offering is that they are setting aside 20-35% of shares in the offering for retail investors who are Robinhood customers through Robinhood’s “IPO access” feature. I’ve written in the past about democratizing the IPO and how brokerages and companies should allow their users to get in at the IPO price, and it’s nice that Robinhood is doing that for its customers.
I’m really interested to see how the IPO and the post-IPO trading go. It’s funny to think that if it becomes a meme stock, and Robinhooders use Robinhood to drive up the stock price of Robinhood, the increased transaction volumes and the corresponding revenue for Robinhood could justify the higher stock prices.
Thanks for reading! If you liked this post, give it a heart up above to help others find it or share it with your friends.
If you have any comments or thoughts, feel free to tweet at me.
If you’re not a subscriber, you can subscribe below. I write about things related to technology and business once a week on Mondays.


Very nice