

Doordash and Profitable Food Delivery
There’s been a longstanding belief in some circles that food delivery companies would never be profitable, and they only worked because of an abundance of cheap capital which was subsidizing customers and delivery people.
Grubhub in their shareholder letter in 2019 said the following:
But, we didn’t then, and still don't believe now, that a company can generate significant profits on just the logistics component of the business. It is a commodity and there are significant variable costs that are hard to leverage even with technology and scale. Extremely large delivery/logistics companies can generate slim margins, but only because of the hub and spoke efficiencies they gain at substantial scale.
Doordash’s S-1 allows us to understand better the economics of the leader in this space in the US, and helps refute the idea that these companies will never be profitable.
Sure, Doordash made a net loss in its most recent quarter, but its also still growing >200%. In fact, it had a net profitable quarter while growing at >200% which is very impressive (albeit in this COVID world). Below, I’ll unpack some of the key things that stood out to me while going through the Doordash S-1 including what kind of margins I believe Doordash can achieve.
Impressive growth and increasing market share
Food delivery saw an unprecedented acceleration in COVID-19, and Doordash was a key beneficiary. But Doordash has also been out executing the competition in the US and capturing share, rather than just benefiting from the growing market.
They grew revenue and marketplace GOV ~200% each in 2019 (pre-COVID), and that growth has further accelerated in 2020 so far so to 226%. As the table below shows, most of their revenue growth has been driven by more orders, with average order value relatively flat and take rates increasing marginally. The COVID-19 impact is visible in Q2 of 2020 onwards, where the number of orders skyrocketed.

As the chart from their S-1 below shows, they’ve gone from 17% to 50% share in under 3 years. SecondMeasure’s data shows similar numbers, with them having ~49% share in September of this year.


So how did they manage to do this? If I had to pinpoint just a few things, two that stand out to me are:
Strategic Focus on Suburban Markets: Doordash started with a strategic focus on suburban markets, where they believed there was a willingness to pay for convenience and there was less competition. They’ve grown to urban areas since, but have continued to capture outsized share in the suburban markets they’ve focused on, with a 58% suburban market share (compared to 50% overall). Their insight was these places were underserved, and while the economics didn’t make sense for individual restaurants there to operate and provide delivery, the economics could work if a third party (i.e., them) did it at scale. These markets also have higher average order values and a higher willingness to pay fees for convenience.
Partnerships: Door has partnerships with 175 of the top 200 largest restaurant brands, which speaks to the selection available on the platform. Also, through partnerships with Merchants and Chase Sapphire, they have managed to grow their Dashpass loyalty program to over 5M members, establishing some level of loyalty in a business with zero switching costs.
Customer Cohorts and Looking Beyond Financials
One caveat with looking at financials for a business like this is that we can never see the true profitability in the financials because the company is investing in growing the business and acquiring new customers, and incurring the acquisition costs (i.e., sales and marketing spend) from those customers today but capturing the benefits over a period of time (the same is also often true for the R&D expense).
Once Doordash acquires a customer, they continue to spend on Doordash (and increase their spend on Doordash) in future years, making Doordash’s revenue in some sense repeating. The chart below of Marketplace GOV by Cohort help show this. On average, customer cohorts increase their spend significantly in the following year and then retain at somewhere near that level of spend.

And while the revenue from a customer grows in future periods, the marketing and sales expenses don’t scale proportionately. While Doordash incurs somewhere around 6-10% of GMV (i.e, 55 - 100% of revenue) from a customer in their first year to acquire them, it only costs them 2% of that’s customers GMV (i.e., ~18-20% of revenue) in a given year) to retain them.

And so perhaps unsurprisingly, what we see is that Doordash loses money in the first year on a set of customers, but then is profitable from that set of customers given lowered expenses on acquisition and promotions. In addition, the take rates on average tend to be higher for older cohorts (~15% vs 12% on average), implying that Doordash is converting a higher share of the spend from those customers to revenue.


To summarize, once Doordash acquires a set of customers, they continue to spend on the platform in future years (~40-50% more). Doordash captures a higher share of this spend as revenue (~11-13% in year 1 vs 15% in later years), and Doordash incurs much lower marketing costs on them. This results in making 8% of GOV (or ~50% of revenue contribution margins on these customers in later years).
Improving Profitability
Perhaps more impressive than the topline growth has been the incredible improvements in Doordash’s profitability, where operating margins have gone from large double-digit negative percentages to very close to profitable (even turning a profit in Q2). In fact, their contribution margins and adjusted EBITDA margins have been 20%+ and 10%+ in recent quarters (though those adjust to exlclude stock based compensation)
The economics are detailed below on a percentage and per order basis.

There are three key drivers of improved profitability:
Scale: The increased scale, most evident in the declining G&A and R&D per order (and COGS) over time and particularly during COVID-19 (Q2 and Q3)
Higher take rates: Higher take rates (particularly compared to lead to a higher revenue per order, and the cost of revenue has remained flat (and even declined with scale), which translates to higher gross margins per order.
Reduced Marketing and Sales spend: This has been going down for two reasons. One is that as Doordash gets bigger it needs to spend less on S&M since as mentioned earlier its existing customers need a lot less S&M spend to retain them. The other reason was that with COVID, the industry itself has accelerated, so Doordash saw an influx of customers on lower spend.
What’s interesting is that while COVID-19 has greatly accelerated margin improvement, they have in my opinion mostly pulled the economics forward a few years, by showing what things would look like at a greater scale, rather than structurally changing something (i.e., Doordash’s order volumes aren’t bigger now and neither are their take rates). The better economics and faster growth has made Doordash a more attractive business, but I think COVID-19 has helped show that this business model can be profitable, rather than made an unprofitable business model profitable.
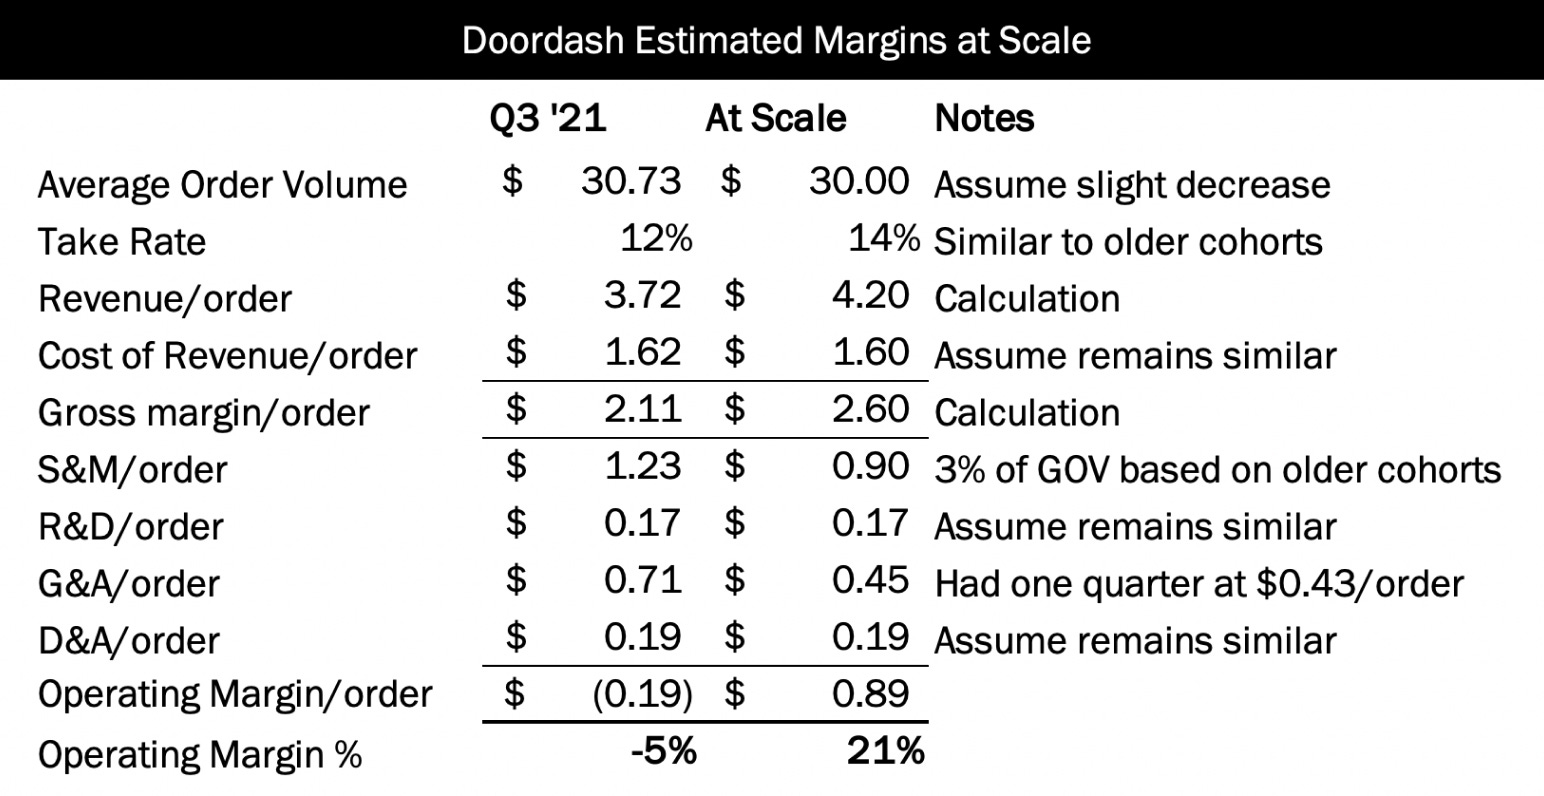
Margins at Scale
So just how profitable can Doordash get? Right now they’ve had -5% margins and shown they can do 3% margins, but that’s not great and doesn’t disprove Grubhub’s belief that this is mostly a commodity business.
So how much better could they do? One thought experiment is that if Doordash wasn’t focused on adding too many new customers and was close to scale, what kind of margins could it achieve?
Driven by an increase in its take rates and a reduction in sales and marketing spend and G&A, I see the potential for at least 20% operating margins using relatively baseline estimates detailed below. In reality, there is probably room to do closer to 25-30% at 15% take rates and with lower sales and marketing. That’s pretty impressive and doesn’t factor in a crazy amount of scale or any additional businesses (lead gen, advertising) they may build on top of what they have.
Thanks for reading!
If you liked this post, give it a heart up above to help others find it or share it with your friends and if you have any comments, feel free to tweet me.
If you’re not a subscriber, you can subscribe below. I generally post once every other week on things related to technology or business.
Goes without saying that none of this should be viewed as investment advice.
Thank you so much for sharing and for the great analysis.
One way to look at the GOV by cohort is that Year 1 is not a full year. If you assume that it is half a year, 1x becomes 2x, which makes the following multiples look a bit less impressive by comparison.
Quick typo in the "estimated margins at scale" chart, it says Q3 '21 while I believe you meant Q3 '20